Decision Making
Portion Size Task
Also called: portion size selection task, ideal portion size task, computer-based portion size task, expected satiety task, portion selection
Measure ideal portion size and expected satiety: participants move a bar through 51 portions of pictured foods on a plate, from a fifth to five times a reference portion, and choose the amount they would eat. Nothing is eaten.
3-5 minUntimed
Free to start: 10 free participants per account, then $0.99 per participant for academic research, or any yearly plan. Try it here first, with no account.
- Papers, 2021 to 2025
- 45
- Evidence grade
- C
- Registered clinical studies
- 11
What it measures
Measures the portions people choose. Participants see 8 pictured foods, one at a time on a plate, and move a bar through 51 portion sizes to the amount they would like to eat right now. Studies can also ask for the amount that would keep them full until their next meal. Nothing is eaten.
Constructs
- Portion size selection
- Expected satiety
- Meal planning
- Food choice
Research uses
- Eating behavior and appetite research
- Nutrition and food choice research
- Studies of portion size and food environments
- Comparison of conditions within a study
How the paradigm works
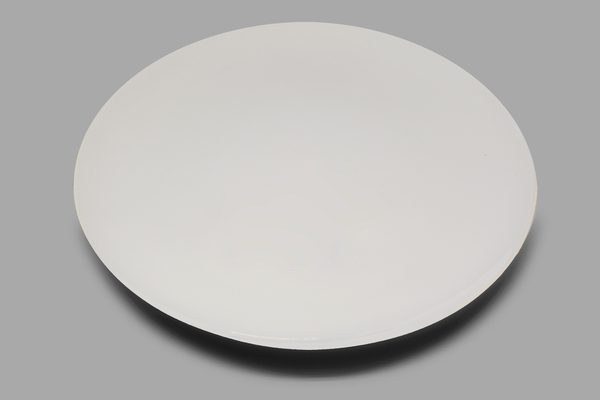
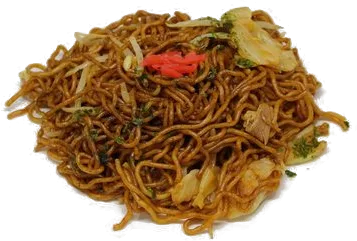
The portion size task measures how much of a food people choose to eat, with the computer-based method of Brunstrom and colleagues (Brunstrom, Shakeshaft and Scott-Samuel, 2008; Wilkinson and colleagues, 2012). Participants see 8 foods, one at a time, on a plate: fried noodles and chicken wings, French fries and a Greek salad, mixed nuts and granola, a fruit salad and berries, from the CROCUFID food photographs (Toet and colleagues, 2019). Moving a bar changes the portion on the plate through 51 sizes, from a fifth to five times a reference portion in equal logarithmic steps, as in Wilkinson and colleagues' 51 photographs of each food; here our code scales one photograph of each food about the plate's center, and the largest portion fills the plate. Each food starts at a portion drawn from the session's seed, and Confirm stays off until the bar has moved. In the standard version people choose the amount they would like to eat right now (ideal portion); a setting asks instead for the amount they would need to eat right now to stay full until their next meal (expected satiety), or asks both, ideal portion first. A practice food, green olives, is moved to both ends of the bar first, and a rating of hunger from 0 to 100 opens the session. A food can be declined with I don't eat this. Nothing is served or eaten, and there is no time limit.
More about the paradigm
The main score is the typical portion chosen, as a multiple of each food's reference portion: the geometric mean over the foods answered, since the portions are spaced in equal ratios. Each food's portion is also reported. In Wilkinson and colleagues' study of 30 adults, the ideal portions chosen on screen correlated with expected satiety (r = .596) and were the only significant predictor of the lunch people then served themselves and ate; 90% of them cleared their plates. An online slider version also gave ideal portions that correlated with expected satiety (rs = .480; Embling and colleagues, 2021). Expected satiety differs widely between foods of the same energy: in Brunstrom and colleagues' data, 200 kcal of pasta and 894 kcal of cashew nuts were expected to be equally filling. The reference portions here are set by the plate, not by energy, so portions are compared food by food, between people or conditions. Scores are research measures; they give no dietary advice and do not judge how anyone eats.
Scores
- Ideal Portionscore
- Geometric mean of the portions chosen as the amount to eat right now, each as a multiple of the food's reference portion, from 0.2 to 5. Declined foods are left out.
- Higher means larger portions chosen
- Expected Satiety Portionscore
- Geometric mean of the portions chosen as the amount needed to stay full until the next meal, each as a multiple of the food's reference portion, from 0.2 to 5. Empty unless the study asks it.
- Higher means more food expected to be needed
- Ideal Portion: Fried Noodlesscore
- Portion of fried noodles chosen for the ideal-portion question, as a multiple of its reference portion; empty when declined or not asked.
- Informational
- Ideal Portion: Chicken Wingsscore
- Portion of chicken wings chosen for the ideal-portion question, as a multiple of its reference portion; empty when declined or not asked.
- Informational
- Ideal Portion: French Friesscore
- Portion of French fries chosen for the ideal-portion question, as a multiple of its reference portion; empty when declined or not asked.
- Informational
- Ideal Portion: Greek Saladscore
- Portion of Greek salad chosen for the ideal-portion question, as a multiple of its reference portion; empty when declined or not asked.
- Informational
- Ideal Portion: Mixed Nutsscore
- Portion of mixed nuts chosen for the ideal-portion question, as a multiple of its reference portion; empty when declined or not asked.
- Informational
- Ideal Portion: Granolascore
- Portion of granola chosen for the ideal-portion question, as a multiple of its reference portion; empty when declined or not asked.
- Informational
- Ideal Portion: Fruit Saladscore
- Portion of fruit salad chosen for the ideal-portion question, as a multiple of its reference portion; empty when declined or not asked.
- Informational
- Ideal Portion: Berriesscore
- Portion of berries chosen for the ideal-portion question, as a multiple of its reference portion; empty when declined or not asked.
- Informational
- Satiety Portion: Fried Noodlesscore
- Portion of fried noodles chosen for the expected-satiety question, as a multiple of its reference portion; empty when declined or not asked.
- Informational
- Satiety Portion: Chicken Wingsscore
- Portion of chicken wings chosen for the expected-satiety question, as a multiple of its reference portion; empty when declined or not asked.
- Informational
- Satiety Portion: French Friesscore
- Portion of French fries chosen for the expected-satiety question, as a multiple of its reference portion; empty when declined or not asked.
- Informational
- Satiety Portion: Greek Saladscore
- Portion of Greek salad chosen for the expected-satiety question, as a multiple of its reference portion; empty when declined or not asked.
- Informational
- Satiety Portion: Mixed Nutsscore
- Portion of mixed nuts chosen for the expected-satiety question, as a multiple of its reference portion; empty when declined or not asked.
- Informational
- Satiety Portion: Granolascore
- Portion of granola chosen for the expected-satiety question, as a multiple of its reference portion; empty when declined or not asked.
- Informational
- Satiety Portion: Fruit Saladscore
- Portion of fruit salad chosen for the expected-satiety question, as a multiple of its reference portion; empty when declined or not asked.
- Informational
- Satiety Portion: Berriesscore
- Portion of berries chosen for the expected-satiety question, as a multiple of its reference portion; empty when declined or not asked.
- Informational
- Foods Declinedcount
- Foods answered with I don't eat this, over the questions asked.
- Informational
- Hungerscore
- Hunger before the foods, from 0 (not at all hungry) to 100 (extremely hungry).
- Informational: a covariate
- Median Choice Timems
- Median time from a food's screen to its answer, over answers given at or after 100 ms.
- Informational
- Answers Under 100 mscount
- Foods answered less than 100 ms after their screen appeared.
- 0 expected
- Foods Answeredcount
- Foods given a portion or declined in the scored run.
- Informational
- Planned Foodscount
- Foods the session planned: 8 for one question, 16 for both.
- Informational
Use and evidence
45 papers from 2021 to 2025 name this task in their title or abstract, up 2% compared with 2016 to 2020. That ranks it 453 of 670 test families in our census. See the counts for every test.
Show the numbers
| Year | Papers |
|---|---|
| 2025 | 9 |
| 2024 | 9 |
| 2023 | 7 |
| 2022 | 11 |
| 2021 | 9 |
| 2020 | 7 |
| 2019 | 15 |
| 2018 | 11 |
| 2017 | 5 |
| 2016 | 6 |
| 2015 | 2 |
| 2014 | 4 |
| 2013 | 3 |
| 2012 | 4 |
| 2011 | 5 |
| 2010 | 0 |
| 2009 | 2 |
| 2008 | 4 |
| 2007 | 1 |
| 2006 | 4 |
| 2005 | 1 |
| 2004 | 0 |
| 2003 | 0 |
| 2002 | 0 |
| 2001 | 0 |
| 2000 | 0 |
Use grade D
30 to 99 papers from 2021 to 2025.
Evidence grade C
At least 2 test-retest papers, 30 reliability or validity papers or 3 registered clinical studies.
- Papers on test-retest reliability
- 1
- Papers on reliability or validity
- 7
- Registered clinical studies using it as an outcome
- 11
Measured on ConductCognition
Pooled across the studies that feed our platform norms, by device group. A figure needs 50 or more people.
No pooled figure yet.
Note on the counts: includes surveys of eating habits.
How the grades work
Use: A is 1,000 or more papers from 2021 to 2025, B 300 to 999, C 100 to 299, D 30 to 99 and E fewer than 30. Evidence: A means at least 25 papers report its test-retest reliability and at least 25 registered clinical studies use it as an outcome; B, at least 8 test-retest papers, and either 5 registered clinical studies or 150 reliability or validity papers; C, at least 2 test-retest papers, 30 reliability or validity papers or 3 registered clinical studies; D, little published measurement evidence found. The counts measure use. They include every paper that names the task in its title or abstract. Grades describe the published research on this task, not ConductCognition's version of it.
Source: ConductCognition test census 0.48.0, counted 12 November 2026 from OpenAlex and ClinicalTrials.gov.
Task design
The trial sequence as the test runs in ConductCognition.
- Pictures
- 8 foods from CROCUFID, an open food picture set: fried noodles and chicken wings, French fries and a Greek salad, mixed nuts and granola, a fruit salad and berries, each cut out of its photograph and shown on an empty plate. The Food Choice Task shows the same photographs; the fries, fruit salad and berries are also in the Food Cue Reactivity Task and the Food-Picture Dot-Probe, and the berries in the Evaluative Conditioning Task.
- Portions
- 51 portions from a fifth to five times a reference portion in equal steps of ratio, drawn by scaling the food about the plate's center; the largest portion fills the plate, and the amount grows with the cube of the picture's size.
- Answer
- A bar the participant drags or moves with the arrow keys, starting at a portion drawn from the session's seed; Confirm stays off until the bar has moved. A food can be declined with I don't eat this.
- Questions
- Standard: the amount the participant would like to eat right now (ideal portion). Settings: the amount needed to stay full until the next meal (expected satiety), or both, ideal portion first.
- Order
- A hunger rating from 0 to 100, then a practice food moved to both ends of the bar, then the foods in an order drawn from the session's seed. No time limit.
- Scores
- The typical portion as a multiple of the reference portion (the geometric mean over the foods), each food's portion, the foods declined and the hunger rating.
Wilkinson and colleagues (2012) showed 51 photographs of each food from 0.2 to 5 times a standard portion; here one photograph of each food is scaled by code, so the reference portions are set by the plate, not by energy, and portions are compared food by food. Ideal portions chosen on screen correlated with expected satiety and predicted the lunch people served themselves and ate. Nothing is served or eaten, no screen gives dietary advice, and the scores do not judge how anyone eats.
Quality checks
Each session is marked valid, needs review or invalid, with the reason, before you see its scores.
Portions have no correct size. Confirming in under 200 ms on at least half of the foods invalidates. A run short of its foods, or one where every food was declined, is flagged.
Why these rules
The task records the portion of each pictured food a person chooses. Preferences are not accuracy scores, and there are no individual percentiles.
No percentile. Scores and quality flags only.
Running this test
Settings you can change
| Setting | Standard | Allowed |
|---|---|---|
| Question | Ideal portion (standard) | Ideal portion (standard), Expected satiety, Both, ideal portion first |
Yearly plans can change settings within these limits. Free and pay-as-you-go studies use the standard settings.
Need a setting this test does not have?
Devices and languages
- Untimed test: runs on desktops, laptops, tablets and phones. Participant devices
- Languages: English, Spanish, French, German, Italian, Portuguese (Brazil), Chinese (Simplified) and Japanese.
- Available on: Every plan, including the free plan.
- No percentile. Scores and quality flags only. How norms work
- Recruiting online? See the setup guides for Prolific, Sona Systems, CloudResearch Connect and Qualtrics.
Cite and describe
Participants completed the Portion Size Task in a web browser (ConductCognition task version 1.0.0, scoring version 1.0.0; Brunstrom JM, Shakeshaft NG, Scott-Samuel NE, 2008), with the standard settings (question: Ideal portion). The main score was ideal portion (geometric mean of the portions chosen as the amount to eat right now, each as a multiple of the food's reference portion, from 0.2 to 5).
ConductCognition versions: task version 1.0.0, scoring version 1.0.0. Every export records the versions each session used, for a methods section.
- Brunstrom, J. M., Shakeshaft, N. G., & Scott-Samuel, N. E. (2008). Measuring 'expected satiety' in a range of common foods using a method of constant stimuli. Appetite, 51(3), 604-614. https://doi.org/10.1016/j.appet.2008.04.017Computer-based measures of expected satiety, which differs between foods of the same energy.
- Wilkinson, L. L., Hinton, E. C., Fay, S. H., Ferriday, D., Rogers, P. J., & Brunstrom, J. M. (2012). Computer-based assessments of expected satiety predict behavioural measures of portion-size selection and food intake. Appetite, 59(3), 933-938. https://doi.org/10.1016/j.appet.2012.09.007The method: 51 portions from 0.2 to 5 times a standard in equal logarithmic steps, a random start and the two questions.
- Embling, R., Lee, M. D., Price, M., & Wilkinson, L. L. (2021). Testing an online measure of portion size selection: A pilot study concerned with the measurement of ideal portion size. Pilot and Feasibility Studies, 7, 177. https://doi.org/10.1186/s40814-021-00908-xThe portions on a slider for online studies, with a practice food moved to both ends.
- Toet, A., Kaneko, D., de Kruijf, I., Ushiama, S., van Schaik, M. G., Brouwer, A.-M., Kallen, V., & van Erp, J. B. F. (2019). CROCUFID: A cross-cultural food image database for research on food elicited affective responses. Frontiers in Psychology, 10, 58. https://doi.org/10.3389/fpsyg.2019.00058The food photographs.
Source papers
- Wilkinson and colleagues (2012): 30 adults; ideal portions chosen on screen correlated with expected satiety (r = .596) and predicted the lunch they served themselves and ate.Paradigm source, Adults
Questions
How long does the Portion Size Task take?
About 3 to 5 minutes, as listed in the test library.
What device does a participant need?
Untimed test: runs on desktops, laptops, tablets and phones. The browser must be Chrome, Edge, Firefox or Safari.
What scores does it produce?
Ideal Portion, Expected Satiety Portion, Ideal Portion: Fried Noodles, Ideal Portion: Chicken Wings, Ideal Portion: French Fries, Ideal Portion: Greek Salad, Ideal Portion: Mixed Nuts, Ideal Portion: Granola, Ideal Portion: Fruit Salad, Ideal Portion: Berries, Satiety Portion: Fried Noodles, Satiety Portion: Chicken Wings, Satiety Portion: French Fries, Satiety Portion: Greek Salad, Satiety Portion: Mixed Nuts, Satiety Portion: Granola, Satiety Portion: Fruit Salad, Satiety Portion: Berries, Foods Declined, Hunger, Median Choice Time, Answers Under 100 ms, Foods Answered and Planned Foods. Each session is also marked valid, needs review or invalid, with the reason.
How widely is the Portion Size Task used in research?
45 papers from 2021 to 2025 name it in their title or abstract, up 2% compared with 2016 to 2020. That ranks it 453 of 670 test families in the ConductCognition test census (use grade D). Source: ConductCognition test census 0.48.0, counted 12 November 2026 from OpenAlex and ClinicalTrials.gov.
How much reliability evidence does the Portion Size Task have?
In the published research, 1 paper reports its test-retest reliability and 11 registered clinical studies use it as an outcome (evidence grade C in the ConductCognition test census).
Does it report a percentile?
No. Scores and quality flags only.
Which settings can a researcher change?
Question (Ideal portion (standard), Expected satiety, Both, ideal portion first). Settings can be changed on yearly plans; free and pay-as-you-go studies use the standard settings.
Which languages can participants use?
Participants can take this test in English, Spanish, French, German, Italian, Portuguese (Brazil), Chinese (Simplified) and Japanese. English is on every plan, and the other languages come with yearly plans. Have a native speaker read the machine-translated text before launch.
Is this a clinical test?
No. ConductCognition is for research use only. It runs, scores and exports the test; clinical interpretation is outside the platform.
Every test: the full test list.
Run this test in your next study
Start free with 10 free participants on any test, then use participant credits or a yearly plan.