Decision Making
Food Choice Task
Also called: dietary self-control task, health and taste food choice task, food decision task
Measure how health and taste guide food choices: participants rate foods for both, then choose between each food and a reference they rated neutral.
7-10 minUntimed
Free to start: 10 free participants per account, then $0.99 per participant for academic research, or any yearly plan. Preview any test free after you sign up.
- Papers, 2021 to 2025
- 92
- Evidence grade
- C
- Registered clinical studies
- 14
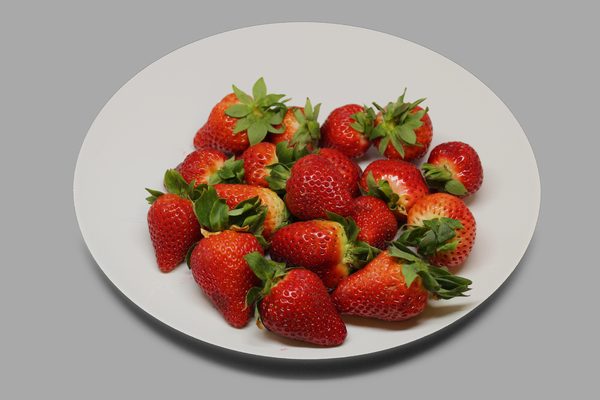
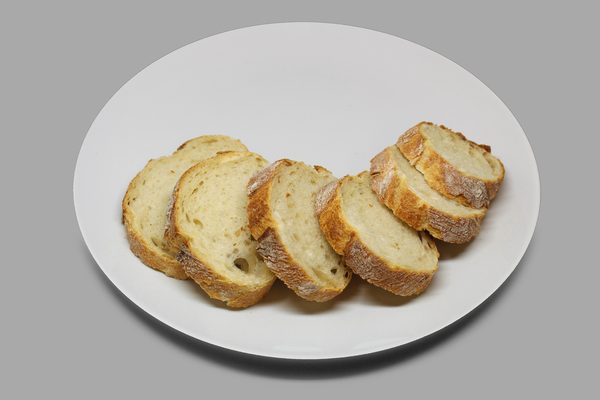 How healthy is this food?Reference food
What it measures
Measures how health and taste guide choices about food. Participants rate pictured foods for how healthy and how tasty they are, then choose between each food and a reference food they rated neutral. The main score is the share of healthier choices when health and taste disagree. No food is offered.
Constructs
- Dietary self-control
- Value-based decision making
- Weighing health and taste
Research uses
- Eating behavior and food decision research at the group level
- Eating disorders research on restrictive food choice
- Within-study comparison of how health and taste guide choices
How the paradigm works
The food choice task measures how much health and taste guide a person's choices about what to eat. Hare, Camerer and Rangel (2009) had people rate foods for taste and for health, then choose between each food and a reference food they had rated neutral on both. People who chose on health as well as taste were called self-controllers. Steinglass and colleagues (2015) adapted the task for eating disorders research with a wider range of everyday foods. In anorexia nervosa, health ratings guided choices more than in healthy volunteers (Steinglass and colleagues, 2015), and choices in the task tracked what patients ate at a meal the next day (Foerde and colleagues, 2015). In healthy volunteers the results were stable over a few days and over a month (Foerde and colleagues, 2018).
More about the paradigm
Participants rate 48 pictured foods twice, in two parts whose order is drawn for each session or set by the researcher: once for how healthy each food is and once for how tasty it is to them, on five points with Neutral in the middle. A food they rated Neutral on both becomes the reference. If there is none, the reference is a food rated Neutral for health and tasty, as in the source papers, and failing that the food closest to Neutral on both. In the last part the reference stays on the left and each of the other 47 foods appears on the right. The participant answers whether they would rather eat the food on the right, from Strong no to Strong yes, choosing as if one choice would be their snack. No food is offered, and no answer has a time limit. One practice question comes before each part. The pictures come from CROCUFID, an open food picture set (Toet and colleagues, 2019); the questions were written for this task.
The main score is the share of healthier choices when health and taste disagree: among the choices where one food was rated healthier and the other tastier, the share in which the participant chose the healthier one, which Hare and colleagues called succeeding at self-control. The task also reports how strongly the health and taste ratings predict the choices (the health and taste weights), the share of choices that went to the food over the reference, how closely the health and taste ratings agree, and the ratings and answer times. The scores describe preferences, not abilities. Scores support research and do not diagnose.
Scores
- Healthier Choices When Health and Taste Disagree%
- Of the choices where one food was rated healthier and the other tastier, the share in which the healthier food was chosen. Neutral answers are left out.
- Higher values mean health won over taste more often; a preference, with no better direction
- Health Weightscore
- Slope of the choice (-2 for Strong no to +2 for Strong yes) on the food's health rating minus the reference's, from a least-squares fit with the taste difference. Needs 10 choices.
- Larger values mean health ratings moved choices more
- Taste Weightscore
- Slope of the choice on the food's taste rating minus the reference's, from the same fit as the health weight.
- Larger values mean taste ratings moved choices more
- Food Chosen over Reference%
- Of the choices that were not Neutral, the share in which the food on the right was chosen over the reference.
- Informational
- Health and Taste Agreementscore
- Pearson's r between the health and the taste ratings across the foods.
- Positive values mean healthier foods were also rated tastier
- Choices with Health and Taste Disagreeingcount
- Choices, other than Neutral answers, where one food was rated healthier and the other tastier: the choices behind the main score.
- Quality check
- Neutral Choicescount
- Choices answered Neutral.
- Informational
- Mean Health Ratingpoints
- Mean health rating across the foods, from 1 (Very unhealthy) to 5 (Very healthy).
- Informational
- Mean Taste Ratingpoints
- Mean taste rating across the foods, from 1 (Very bad) to 5 (Very good).
- Informational
- Reference Health Ratingpoints
- The reference food's health rating: 3, Neutral, unless no food was rated Neutral for health.
- Informational
- Reference Taste Ratingpoints
- The reference food's taste rating: 3, Neutral, unless no food was rated Neutral on both.
- Informational
- Median Rating Timems
- Median time from a rating screen to the answer, leaving out answers under 100 ms.
- Informational
- Median Choice Timems
- Median time from a choice screen to the answer, leaving out answers under 100 ms.
- Informational
- Foods Rateditems
- Foods rated for both health and taste, out of 48.
- Quality check
- Choices Madeitems
- Choices answered, out of 47.
- Quality check
- Health Ratings Usedcount
- How many of the five health ratings were used at least once.
- Quality check
- Taste Ratings Usedcount
- How many of the five taste ratings were used at least once.
- Quality check
- Choice Answers Usedcount
- How many of the five choice answers were used at least once.
- Quality check
- Anticipationscount
- Ratings and choices answered within 100 ms of the screen appearing.
- Quality check
Use and evidence
92 papers from 2021 to 2025 name this task in their title or abstract, up 51% compared with 2016 to 2020. That ranks it 195 of 395 test families in our census. See the counts for every test.
Show the numbers
| Year | Papers |
|---|---|
| 2025 | 35 |
| 2024 | 22 |
| 2023 | 12 |
| 2022 | 6 |
| 2021 | 17 |
| 2020 | 18 |
| 2019 | 17 |
| 2018 | 10 |
| 2017 | 8 |
| 2016 | 8 |
| 2015 | 3 |
| 2014 | 2 |
| 2013 | 5 |
| 2012 | 0 |
| 2011 | 5 |
| 2010 | 3 |
| 2009 | 1 |
| 2008 | 1 |
| 2007 | 2 |
| 2006 | 0 |
| 2005 | 0 |
| 2004 | 0 |
| 2003 | 0 |
| 2002 | 0 |
| 2001 | 1 |
| 2000 | 0 |
Use grade D
30 to 99 papers from 2021 to 2025.
Evidence grade C
At least 2 test-retest papers, 30 reliability or validity papers or 3 registered clinical studies.
- Papers on test-retest reliability
- 4
- Papers on reliability or validity
- 13
- Registered clinical studies using it as an outcome
- 14
How the grades work
Use: A is 1,000 or more papers from 2021 to 2025, B 300 to 999, C 100 to 299, D 30 to 99 and E fewer than 30. Evidence: A means at least 25 papers report its test-retest reliability and at least 25 registered clinical studies use it as an outcome; B, at least 8 test-retest papers, and either 5 registered clinical studies or 150 reliability or validity papers; C, at least 2 test-retest papers, 30 reliability or validity papers or 3 registered clinical studies; D, little published measurement evidence found. The counts measure use. They include every paper that names the task in its title or abstract. Grades describe the published research on this task, not ConductCognition's version of it.
Source: ConductCognition test census 0.14.0, counted 31 October 2026 from OpenAlex and ClinicalTrials.gov.
Task design
The trial sequence as the test runs in ConductCognition.
- Pictures
- 48 pictures of everyday food from CROCUFID, an open food picture set: fruit, vegetables and salads, breads and grains, dairy and eggs, meals, fast food and snacks, nuts, sweets and pastries. No picture shows people or spoiled food.
- Ratings
- Two parts, one for health and one for taste, in an order drawn for each session (standard) or set by the researcher. Each food alone, up to 600 by 400 px, with five buttons from Very unhealthy to Very healthy, or from Very bad to Very good, Neutral in the middle. No time limit.
- Reference food
- A food the participant rated Neutral on both, drawn from the session's seed when there are several. If none: a food Neutral for health and rated 4, then 5, for taste; then 2, then 1; then the food closest to Neutral on both.
- Choices
- The reference on the left and each of the other 47 foods on the right, up to 420 px wide each: Would you rather eat the food on the right than the food on the left? Strong no, No, Neutral, Yes or Strong yes, with no time limit, as if one choice would be the participant's snack. No food is offered.
- Between screens
- The chosen button stays outlined for 200 ms, then a 300 ms blank screen.
- Practice
- One question before each part: a rating of a food outside the set before each rating part, and a choice against a food outside the set before the choices, each followed by a note of the answer.
- Order
- Each part's foods in their own order, drawn from the session's seed.
No food is offered, and no screen mentions calories, weight or diets. Studies of eating disorders also report the share of high-fat foods chosen; this version does not classify the pictured foods by fat, and each choice row names the food so a study can add its own classification. The questions were written for this task.
Quality checks
Each session is marked valid, needs review or invalid, with the reason, before you see its scores.
Scored rows: food_choice_rating and food_choice_choice from the run with the most choices, with no correct answer. Fewer than 24 foods rated on both scales or fewer than 24 choices invalidate. The same health rating or the same taste rating on every food invalidates. The same answer on every choice is flagged, and so are fewer than 5 answered choices where health and taste disagreed. Answers under 200 ms on at least half the ratings and choices invalidate.
Why these rules
There is no correct option to compare with chance, so accuracy is not judged against chance. The scores compare choices with the participant's own ratings, so they need enough of both. A rating that is the same for every food separates nothing, so the session is invalid. The same answer on every choice can be a real preference against a disliked reference, so it is only flagged (long-string checks; Curran 2016). Few choices where health and taste disagreed leave the main score resting on few answers, which is flagged. An answer under 200 ms is faster than a simple visual reaction, so it cannot reflect the item. Following response-time effort screening for untimed tests (Wise and Kong 2005), the session is invalid only when at least half the answers are that fast.
No percentile. Scores and quality flags only.
Running this test
Settings you can change
| Setting | Standard | Allowed |
|---|---|---|
| Order of the rating parts | Counterbalanced (standard) | Counterbalanced (standard), Health first, Taste first |
Yearly plans can change settings within these limits. Free and pay-as-you-go studies use the standard settings.
Need a setting this test does not have?
Devices and languages
- Untimed test: runs on desktops, laptops, tablets and phones. Participant devices
- Languages: English, Spanish, French, German, Italian, Portuguese (Brazil), Chinese (Simplified) and Japanese.
- Available on: Every plan, including the free plan.
- No percentile. Scores and quality flags only. How norms work
- Recruiting online? See the setup guides for Prolific, Sona Systems, CloudResearch Connect and Qualtrics.
Cite and describe
Participants completed the Food Choice Task in a web browser (ConductCognition task version 1.0.0, scoring version 1.0.0; Hare, Camerer & Rangel, 2009; Steinglass et al., 2015), with the standard settings (order of the rating parts: Counterbalanced). The main score was healthier choices when health and taste disagree (of the choices where one food was rated healthier and the other tastier, the share in which the healthier food was chosen).
ConductCognition versions: task version 1.0.0, scoring version 1.0.0. Every export records the versions each session used, for a methods section.
- Hare, T. A., Camerer, C. F., & Rangel, A. (2009). Self-control in decision-making involves modulation of the vmPFC valuation system. Science, 324(5927), 646-648. https://doi.org/10.1126/science.1168450
- Steinglass, J., Foerde, K., Kostro, K., Shohamy, D., & Walsh, B. T. (2015). Restrictive food intake as a choice: A paradigm for study. International Journal of Eating Disorders, 48(1), 59-66. https://doi.org/10.1002/eat.22345
- Foerde, K., Steinglass, J. E., Shohamy, D., & Walsh, B. T. (2015). Neural mechanisms supporting maladaptive food choices in anorexia nervosa. Nature Neuroscience, 18(11), 1571-1573. https://doi.org/10.1038/nn.4136The reference rule, the five-point scales and the choice between the reference and each food shown side by side.
- Foerde, K., Gianini, L., Wang, Y., Wu, P., Shohamy, D., Walsh, B. T., & Steinglass, J. E. (2018). Assessment of test-retest reliability of a food choice task among healthy individuals. Appetite, 123, 352-356. https://doi.org/10.1016/j.appet.2018.01.010Test-retest reliability in healthy volunteers.
- Hare, T. A., Malmaud, J., & Rangel, A. (2011). Focusing attention on the health aspects of foods changes value signals in vmPFC and improves dietary choice. Journal of Neuroscience, 31(30), 11077-11087. https://doi.org/10.1523/JNEUROSCI.6383-10.2011The health and taste weights: a regression of the choice scale on the health and taste ratings.
- Toet, A., Kaneko, D., de Kruijf, I., Ushiama, S., van Schaik, M. G., Brouwer, A.-M., Kallen, V., & van Erp, J. B. F. (2019). CROCUFID: A cross-cultural food image database for research on food elicited affective responses. Frontiers in Psychology, 10, 58. https://doi.org/10.3389/fpsyg.2019.00058The food pictures, and the desire-to-eat ratings used to choose the added foods.
Source papers
- Steinglass J, Foerde K, Kostro K, Shohamy D, Walsh BT (2015). Restrictive food intake as a choice: A paradigm for study. International Journal of Eating Disorders, 48(1):59-66.Paradigm source, Adults
- Foerde K, Gianini L, Wang Y, Wu P, Shohamy D, Walsh BT, Steinglass JE (2018). Assessment of test-retest reliability of a food choice task among healthy individuals. Appetite, 123:352-356.Paradigm source, Adults
- No normative data for this task.Paradigm source, N/A
Questions
How long does the Food Choice Task take?
About 7 to 10 minutes, as listed in the test library.
What device does a participant need?
Untimed test: runs on desktops, laptops, tablets and phones. The browser must be Chrome, Edge, Firefox or Safari.
What scores does it produce?
Healthier Choices When Health and Taste Disagree, Health Weight, Taste Weight, Food Chosen over Reference, Health and Taste Agreement, Choices with Health and Taste Disagreeing, Neutral Choices, Mean Health Rating, Mean Taste Rating, Reference Health Rating, Reference Taste Rating, Median Rating Time, Median Choice Time, Foods Rated, Choices Made, Health Ratings Used, Taste Ratings Used, Choice Answers Used and Anticipations. Each session is also marked valid, needs review or invalid, with the reason.
How widely is the Food Choice Task used in research?
92 papers from 2021 to 2025 name it in their title or abstract, up 51% compared with 2016 to 2020. That ranks it 195 of 395 test families in the ConductCognition test census (use grade D). Source: ConductCognition test census 0.14.0, counted 31 October 2026 from OpenAlex and ClinicalTrials.gov.
How much reliability evidence does the Food Choice Task have?
In the published research, 4 papers report its test-retest reliability and 14 registered clinical studies use it as an outcome (evidence grade C in the ConductCognition test census).
Does it report a percentile?
No. Scores and quality flags only.
Which settings can a researcher change?
Order of the rating parts (Counterbalanced (standard), Health first, Taste first). Settings can be changed on yearly plans; free and pay-as-you-go studies use the standard settings.
Which languages can participants use?
Participants can take this test in English, Spanish, French, German, Italian, Portuguese (Brazil), Chinese (Simplified) and Japanese. English is on every plan, and the other languages come with yearly plans. Have a native speaker read the machine-translated text before launch.
Is this a clinical test?
No. ConductCognition is for research use only. It runs, scores and exports the test; clinical interpretation is outside the platform.
Every test: the full test list.
Run this test in your next study
Start free with 10 free participants on any test, then use participant credits or a yearly plan.