Attention
Overlapping Outlines Task
Also called: overlapping figures test, overlapping figures task, Poppelreuter figures, overlapping line drawings task
An overlapping figures task: the outlines of 2, 3 or 4 everyday objects are drawn over one another, and participants choose the objects they find from a set of pictures. Scored as objects found, with the time per drawing.
3-6 minUntimed
Free to start: 10 free participants per account, then $0.99 per participant for academic research, or any yearly plan. Try it here first, with no account.
- Papers, 2021 to 2025
- 12
- Evidence grade
- D
- Registered clinical studies
- 1

What it measures
An overlapping figures task: each drawing shows the outlines of 2, 3 or 4 everyday objects drawn over one another, and participants choose the pictures of the objects they find from a set of choices, with no time limit. The main score is the number of objects found, with the time each drawing took.
Constructs
- Visual object recognition
- Telling figures from each other (figure-ground)
- Visual search among lines
Research uses
- Research on visual recognition after stroke or brain injury
- Studies of visual perception in aging and dementia
- Within-study group comparison
How the paradigm works
The Overlapping Outlines Task is an overlapping figures task: the outlines of several objects are drawn over one another, and the participant finds the objects in the tangle. Poppelreuter (1917) drew such figures to study how soldiers with head wounds recognized objects, Ghent (1956) used them with children, and later clinical work used them after stroke and in dementia, with the objects named or pointed to (Della Sala and colleagues 1995; Alegret and colleagues 2010).
More about the paradigm
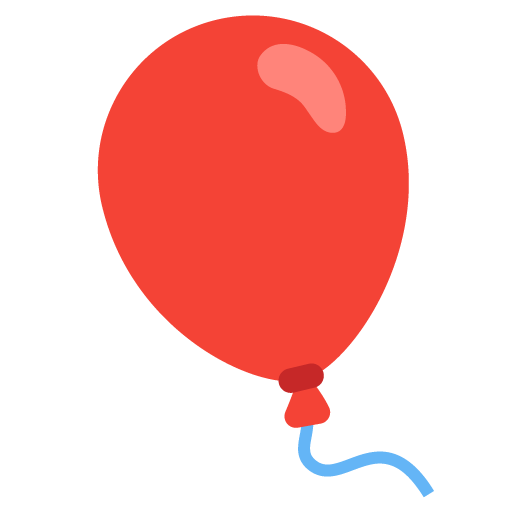
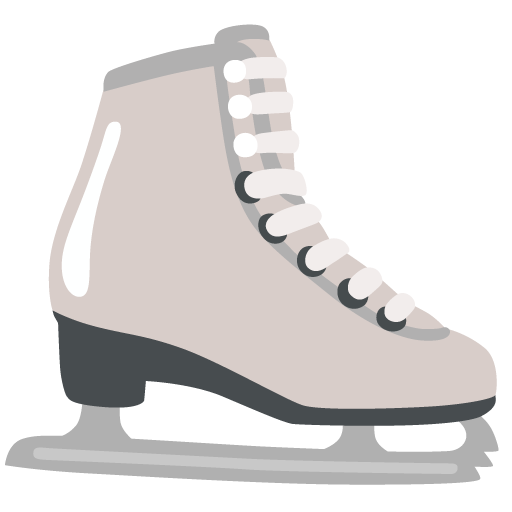
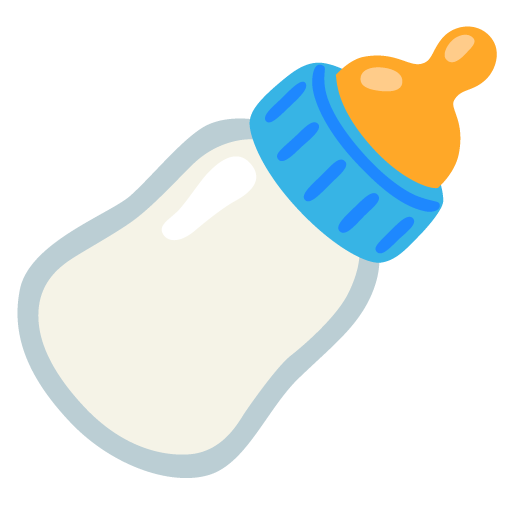
In this version each drawing shows the outlines of 2, 3 or 4 everyday objects, traced from Noto Emoji pictures and drawn as dark lines of one width on white. The outlines are about two thirds the size of the drawing, with their middles spread around its center, so every outline crosses the others. The choices are the Noto pictures themselves, in color: the drawing's objects and as many other objects plus two, 6, 8 or 10 pictures in a seeded order. Participants choose as many pictures as the drawing has objects, by click, tap or keyboard, and then Done; a chosen picture can be taken back. There is no time limit. The standard test has 12 drawings (9 or 6 as settings), a third with 2 objects, then a third with 3 and a third with 4, in a seeded order within each size, after two practice drawings with feedback: two outlines side by side, then two drawn over each other. Each object is in one drawing only, and is a choice in one or two others.
The main score is the number of objects found, out of 36 in the standard test, with the median time per drawing. The task also reports accuracy for drawings of each size, the drawings with every object found and the time per object. Most healthy adults find nearly all the objects: in Alegret and colleagues' (2010) study, healthy older adults named about 13.5 of 15 overlapping objects, so scores can come near the top of the scale. Scores support research and do not diagnose.
Scores
- Objects Foundcount
- Pictures chosen that are objects of their drawing, over the test drawings.
- Higher is better
- Objects Showncount
- Objects in the test drawings (36 in the standard test).
- Informational
- Accuracy%
- Objects found over objects shown.
- Higher is better; chance is about 0.37
- Accuracy, 2 Objects%
- Share of objects found in the drawings of 2 objects.
- Higher is better
- Accuracy, 3 Objects%
- Share of objects found in the drawings of 3 objects.
- Higher is better
- Accuracy, 4 Objects%
- Share of objects found in the drawings of 4 objects.
- Higher is better
- Drawings Fully Foundcount
- Drawings with every object found.
- Higher is better
- Median Time per Drawingms
- Median time from a drawing's onset to Done.
- Lower is faster; the test has no time limit
- Median Time per Objectms
- Median of each drawing's time over its number of objects.
- Lower is faster
- Anticipationscount
- Choices within 100 ms of a drawing's onset. They are not taken.
- Lower is better
- Drawings Answeredtrials
- Test drawings recorded in the scored run.
- Fewer than planned is flagged for review
- Planned Drawingstrials
- Test drawings the session planned to show.
- Informational
Use and evidence
12 papers from 2021 to 2025 name this task in their title or abstract. That ranks it 442 of 495 test families in our census. See the counts for every test.
Show the numbers
| Year | Papers |
|---|---|
| 2025 | 3 |
| 2024 | 2 |
| 2023 | 2 |
| 2022 | 3 |
| 2021 | 2 |
| 2020 | 0 |
| 2019 | 2 |
| 2018 | 1 |
| 2017 | 2 |
| 2016 | 2 |
| 2015 | 1 |
| 2014 | 2 |
| 2013 | 2 |
| 2012 | 2 |
| 2011 | 4 |
| 2010 | 2 |
| 2009 | 4 |
| 2008 | 1 |
| 2007 | 3 |
| 2006 | 2 |
| 2005 | 0 |
| 2004 | 3 |
| 2003 | 7 |
| 2002 | 3 |
| 2001 | 2 |
| 2000 | 1 |
Use grade E
Fewer than 30 papers from 2021 to 2025.
Evidence grade D
Little published measurement evidence found.
- Papers on test-retest reliability
- 0
- Papers on reliability or validity
- 4
- Registered clinical studies using it as an outcome
- 1
How the grades work
Use: A is 1,000 or more papers from 2021 to 2025, B 300 to 999, C 100 to 299, D 30 to 99 and E fewer than 30. Evidence: A means at least 25 papers report its test-retest reliability and at least 25 registered clinical studies use it as an outcome; B, at least 8 test-retest papers, and either 5 registered clinical studies or 150 reliability or validity papers; C, at least 2 test-retest papers, 30 reliability or validity papers or 3 registered clinical studies; D, little published measurement evidence found. The counts measure use. They include every paper that names the task in its title or abstract. Grades describe the published research on this task, not ConductCognition's version of it.
Source: ConductCognition test census 0.22.0, counted 2 November 2026 from OpenAlex and ClinicalTrials.gov.
Task design
The trial sequence as the test runs in ConductCognition.
- Drawings
- Outlines of 2, 3 or 4 everyday objects traced from Noto Emoji pictures, drawn over one another as dark lines of one width on white. Each outline is about two thirds the size of the drawing, and their middles are spread around its center.
- Choices
- The Noto pictures of the drawing's objects and as many other objects plus two: 6, 8 or 10 pictures, in a seeded order. Each object is in one drawing and a choice in one or two others.
- Answer
- Choose as many pictures as the drawing has objects, by click, tap or keyboard, then Done. Choosing a picture again takes it back. No time limit, and 400 ms between drawings.
- Drawings per session
- 12 drawings (standard; 9 or 6), a third each with 2, 3 and 4 objects, in that order and in a seeded order within each size. The drawings are the same for every session.
- Practice
- 2 drawings of 2 objects, side by side and then over each other, with the objects found and missed marked after each.
- Scores
- Objects found (36 in the standard test), accuracy for each size of drawing, the drawings with every object found, and the median times per drawing and per object.
The drawings, choices and name are our own; no published overlapping figures test's figures are used. Most of the pictures also appear in other tests, among them the Mnemonic Similarity Task, the Change Blindness Task and the Directed Forgetting Task. The scores support research and do not diagnose.
Quality checks
Each session is marked valid, needs review or invalid, with the reason, before you see its scores.
Scored rows: overlapping_figures_test from the scored run, one response for each picture chosen, right when it is an object of the drawing, with no time limit (chance: the drawing's objects over its choices, 2 in 6, 3 in 8 or 4 in 10). Below chance invalidates and not above chance is flagged. Drawings finished in under 200 ms, on at least half of them, invalidate. A run short of its planned drawings is flagged for review.
Why these rules
Accuracy significantly below chance (one-sided exact test, p < .05) cannot come from guessing; it means the response mapping was reversed or the task was not followed (Slick, Sherman and Iverson 1999 treat below-chance forced-choice performance as definite response bias). Chance-level accuracy can be a real result in impaired participants, so it is only flagged. An answer under 200 ms is faster than a simple visual reaction, so it cannot reflect the item. Following response-time effort screening for untimed tests (Wise and Kong 2005), the session is invalid only when at least half the answers are that fast. The pictures differ from drawing to drawing, so choosing the same picture is not a sign of anything and is not checked.
Running this test
Settings you can change
| Setting | Standard | Allowed |
|---|---|---|
| Number of drawings | 12 (standard) | 12 (standard), 9, 6 |
Yearly plans can change settings within these limits. Free and pay-as-you-go studies use the standard settings.
Need a setting this test does not have?
Devices and languages
- Untimed test: runs on desktops, laptops, tablets and phones. Participant devices
- Languages: English, Spanish, French, German, Italian, Portuguese (Brazil), Chinese (Simplified) and Japanese.
- Available on: Every plan, including the free plan.
- Recruiting online? See the setup guides for Prolific, Sona Systems, CloudResearch Connect and Qualtrics.
Cite and describe
Participants completed the Overlapping Outlines Task in a web browser (ConductCognition task version 1.0.0, scoring version 1.0.0; Poppelreuter, 1917; Ghent, 1956), with the standard settings (number of drawings: 12). The main score was objects found (pictures chosen that are objects of their drawing, over the test drawings).
ConductCognition versions: task version 1.0.0, scoring version 1.0.0. Every export records the versions each session used, for a methods section.
- Poppelreuter, W. (1990). Disturbances of lower and higher visual capacities caused by occipital damage (J. Zihl & L. Weiskrantz, Trans.). Clarendon Press. (Original work published 1917) https://doi.org/10.1093/acprof:oso/9780198521907.001.0001Line drawings of objects drawn over one another, to study object recognition after head wounds.
- Ghent, L. (1956). Perception of overlapping and embedded figures by children of different ages. The American Journal of Psychology, 69(4), 575. https://doi.org/10.2307/1419081Overlapping figures with children of different ages.
- Della Sala, S., Laiacona, M., Trivelli, C., & Spinnler, H. (1995). Poppelreuter-Ghent's overlapping figures test: Its sensitivity to age, and its clinical use. Archives of Clinical Neuropsychology, 10(6), 511-534. https://doi.org/10.1093/arclin/10.6.511Overlapping figures in healthy adults, in Alzheimer's disease and after right or left hemisphere damage, with effects of age and education.
- Alegret, M., Vinyes-Junqué, G., Boada, M., Martínez-Lage, P., Cuberas, G., Espinosa, A., Roca, I., Hernández, I., Valero, S., Rosende-Roca, M., Mauleón, A., Becker, J. T., & Tárraga, L. (2010). Brain perfusion correlates of visuoperceptual deficits in mild cognitive impairment and mild Alzheimer's disease. Journal of Alzheimer's Disease, 21(2), 557-567. https://doi.org/10.3233/JAD-2010-091069Overlapping objects named with no time limit, in mild cognitive impairment and mild Alzheimer's disease.
Source papers
- Poppelreuter W (1990). Disturbances of lower and higher visual capacities caused by occipital damage (J Zihl, L Weiskrantz, trans.). Oxford: Clarendon Press. First published in German in 1917.Paradigm source, Adults
Questions
How long does the Overlapping Outlines Task take?
About 3 to 6 minutes, as listed in the test library.
What device does a participant need?
Untimed test: runs on desktops, laptops, tablets and phones. The browser must be Chrome, Edge, Firefox or Safari.
What scores does it produce?
Objects Found, Objects Shown, Accuracy, Accuracy, 2 Objects, Accuracy, 3 Objects, Accuracy, 4 Objects, Drawings Fully Found, Median Time per Drawing, Median Time per Object, Anticipations, Drawings Answered and Planned Drawings. Each session is also marked valid, needs review or invalid, with the reason.
How widely is the Overlapping Outlines Task used in research?
12 papers from 2021 to 2025 name it in their title or abstract. That ranks it 442 of 495 test families in the ConductCognition test census (use grade E). Source: ConductCognition test census 0.22.0, counted 2 November 2026 from OpenAlex and ClinicalTrials.gov.
How much reliability evidence does the Overlapping Outlines Task have?
In the published research, 0 papers report its test-retest reliability and 1 registered clinical study uses it as an outcome (evidence grade D in the ConductCognition test census).
Which settings can a researcher change?
Number of drawings (12 (standard), 9, 6). Settings can be changed on yearly plans; free and pay-as-you-go studies use the standard settings.
Which languages can participants use?
Participants can take this test in English, Spanish, French, German, Italian, Portuguese (Brazil), Chinese (Simplified) and Japanese. English is on every plan, and the other languages come with yearly plans. Have a native speaker read the machine-translated text before launch.
Is this a clinical test?
No. ConductCognition is for research use only. It runs, scores and exports the test; clinical interpretation is outside the platform.
Every test: the full test list.
Run this test in your next study
Start free with 10 free participants on any test, then use participant credits or a yearly plan.