Episodic Memory
Misinformation Effect Task
Also called: misinformation paradigm, misleading postevent information, eyewitness suggestibility task, misinformation test
Measure how a misleading description changes memory: a story in pictures, a description that gets some details wrong, then a choice of what was seen.
7-9 minUntimed
Free to start: 10 free participants per account, then $0.99 per participant for academic research, or any yearly plan. Preview any test free after you sign up.
- Papers, 2021 to 2025
- 143
- Evidence grade
- C
- Registered clinical studies
- 0
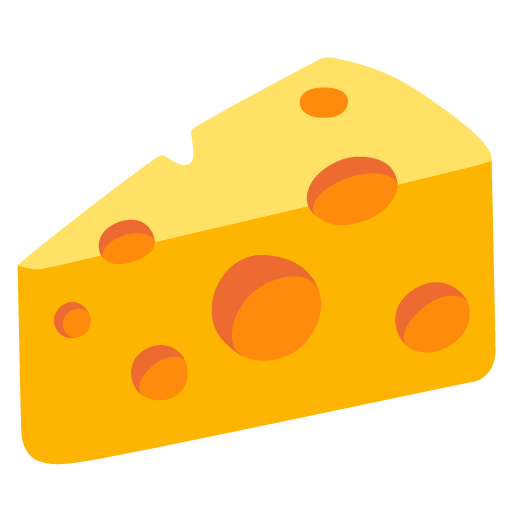
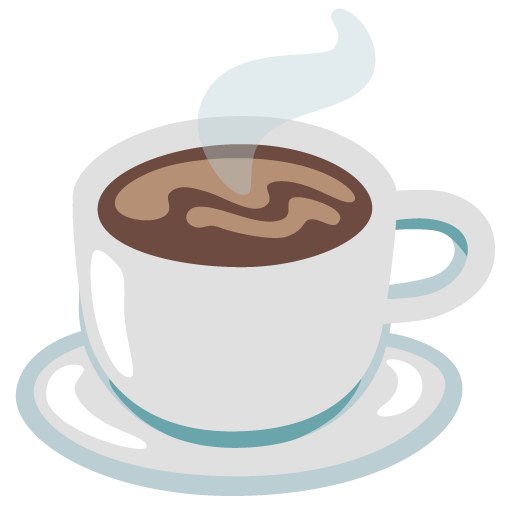
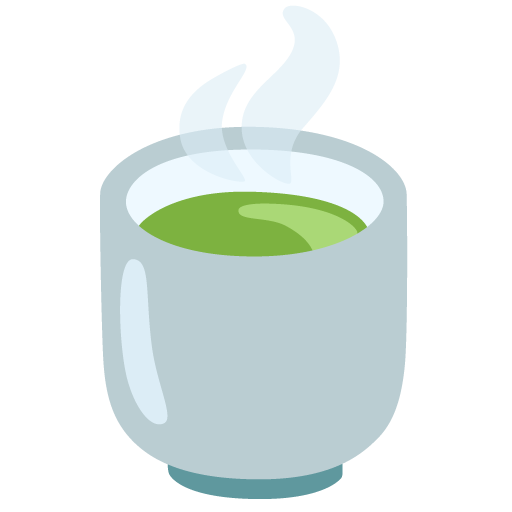
A piece of cheese and a doughnut were on the table. Beside them stood a cup of tea.
What it measures
Measures how a description read later changes memory for an event. Participants watch a short story in pictures, read a description that gets some details wrong, then choose which of two pictures was in the story. The main score is the drop in accuracy on the details the description got wrong.
Constructs
- Misinformation effect
- Suggestibility
- Source monitoring
- Episodic memory
Research uses
- Eyewitness memory research
- False memory and suggestibility research
- Within-study group comparison
How the paradigm works
The Misinformation Effect Task measures how a description read after an event changes what people remember of it. Participants watch a short story of 8 scenes, a day from breakfast to evening, each shown for 6 seconds: emoji pictures set on simple drawn rooms and landscapes, with no words. After 60 seconds of true-or-false arithmetic, they read a description of the story in 8 short pages, one per scene. Each scene holds two details asked about later. On every page the description names the other version of one detail, such as tea where the picture showed coffee (a misled detail), and mentions the other detail without naming either version, such as a hot drink (a control detail). The description is otherwise accurate. Right after it, 16 questions each show the two versions of one detail, and participants choose the one that was in the pictures, with no time limit. A practice picture with two questions and feedback comes first. Unless the researcher turns it off, the last screen explains that some details were wrong on purpose. The design follows Loftus, Miller and Burns (1978), who found that misleading information lowered accuracy on a two-choice test, and more so when it came just before the test than just after the event; the description is a narrative, as in Zhu and colleagues (2010). Researchers can set 4 to 10 seconds per scene, 0 to 300 seconds of arithmetic and whether to show the explanation.
More about the paradigm
The scenes, the story and the description were written for this task, and the pictures are 53 emoji from Noto Emoji, a freely licensed set. Each detail is one of the look-alike pairs of the Mnemonic Similarity Task: two objects of one kind, such as a tiger and a leopard, or one object in two colors or states, such as a green and a blue book. Run the two tests in different sessions. The session's seed draws which version of each detail the pictures show and which detail of each scene is misled, so across sessions every detail is misled and control equally often. The description is written in each of the app's eight languages.
The primary score is the misinformation effect: accuracy on control details minus accuracy on misled details, where accuracy is the share of questions answered with the version seen. A positive score means the misleading sentences drew answers away from what was seen. Scores also give the accuracy on each kind of detail, the number of misled details answered with the version the description named, the median answer time and the time spent reading the description. With 8 details of each kind the score suits group comparisons best. Part of the effect can come from people who did not notice a detail choosing what they read, rather than from a changed memory; McCloskey and Zaragoza (1985) separate the two with a test that offers a new version in place of the named one. Scores support research and do not diagnose.
Scores
- Misinformation Effect%
- Accuracy on control details minus accuracy on misled details.
- Positive means the misleading sentences lowered accuracy
- Accuracy, Misled Details%
- Share of misled details answered with the version seen in the pictures.
- Lower means more answers followed the description
- Accuracy, Control Details%
- Share of control details answered with the version seen in the pictures.
- At or under 0.5 is flagged for review
- Accuracy%
- Share of all questions answered with the version seen.
- Context for the scores
- Suggestions Chosencount
- Misled details answered with the version the description named.
- Higher means more answers followed the description
- Median Answer Timems
- Median time from a question to its answer, over answers at or after 100 ms.
- Context for the scores
- Reading Timeseconds
- Time spent on the 8 pages of the description, in all.
- Context for the scores
- Median Reading Time per Pageseconds
- Median time spent on a page of the description. The Next button wakes after 3 seconds.
- Context for the scores
- Anticipationscount
- Answers under 100 ms. They still count as answers.
- Context for the scores
- Questions Answeredcount
- Questions answered in the run.
- Fewer than half of those planned invalidates the session
- Questions Plannedcount
- Questions the plan held: one for each detail.
- Fewer answered than planned is flagged for review
Use and evidence
143 papers from 2021 to 2025 name this task in their title or abstract, up 15% compared with 2016 to 2020. That ranks it 156 of 395 test families in our census. See the counts for every test.
Show the numbers
| Year | Papers |
|---|---|
| 2025 | 43 |
| 2024 | 33 |
| 2023 | 21 |
| 2022 | 21 |
| 2021 | 25 |
| 2020 | 22 |
| 2019 | 17 |
| 2018 | 26 |
| 2017 | 32 |
| 2016 | 27 |
| 2015 | 19 |
| 2014 | 19 |
| 2013 | 30 |
| 2012 | 27 |
| 2011 | 18 |
| 2010 | 15 |
| 2009 | 11 |
| 2008 | 8 |
| 2007 | 10 |
| 2006 | 11 |
| 2005 | 6 |
| 2004 | 9 |
| 2003 | 2 |
| 2002 | 4 |
| 2001 | 4 |
| 2000 | 7 |
Use grade C
100 to 299 papers from 2021 to 2025.
Evidence grade C
At least 2 test-retest papers, 30 reliability or validity papers or 3 registered clinical studies.
- Papers on test-retest reliability
- 0
- Papers on reliability or validity
- 32
- Registered clinical studies using it as an outcome
- 0
How the grades work
Use: A is 1,000 or more papers from 2021 to 2025, B 300 to 999, C 100 to 299, D 30 to 99 and E fewer than 30. Evidence: A means at least 25 papers report its test-retest reliability and at least 25 registered clinical studies use it as an outcome; B, at least 8 test-retest papers, and either 5 registered clinical studies or 150 reliability or validity papers; C, at least 2 test-retest papers, 30 reliability or validity papers or 3 registered clinical studies; D, little published measurement evidence found. The counts measure use. They include every paper that names the task in its title or abstract. Grades describe the published research on this task, not ConductCognition's version of it.
Source: ConductCognition test census 0.14.0, counted 31 October 2026 from OpenAlex and ClinicalTrials.gov.
Task design
The trial sequence as the test runs in ConductCognition.
- Story
- 8 scenes of one day, each shown for 6 seconds (standard; 4 to 10) with a 500 ms blank: emoji from Noto Emoji, a freely licensed set, set on rooms and landscapes our code draws, with no words. Each scene holds 2 details asked about later.
- Details
- 16 look-alike pairs from the Mnemonic Similarity Task: two objects of one kind, such as a tiger and a leopard, or one object in two colors or states. The session's seed draws which version each scene shows.
- Delay
- 60 seconds (standard; 0 to 300) of true-or-false arithmetic between the story and the description.
- Description
- 8 short pages, one per scene, read at the participant's pace; Next wakes after 3 seconds. Each page names the other version of one detail (misled) and neither version of the other (control), chosen from the seed.
- Test
- 16 questions, one per detail, each showing the version seen and the other version side by side, with no time limit. No two details of one scene in a row and no more than 3 misled or control in a row; the version seen is on the left for half of each kind.
- Practice and debrief
- A practice picture with 2 questions and feedback comes first. The last screen explains the misleading details, unless the researcher turns it off.
The story, the description and the scenes were written for this task; the pictures are emoji that the Mnemonic Similarity Task also shows, so run the two in different sessions. The description is in the session's language.
Quality checks
Each session is marked valid, needs review or invalid, with the reason, before you see its scores.
Scored rows: misinformation_effect_test from the scored run, a choice between two pictures for each detail with no time limit, the side of the picture seen drawn and balanced. Only control details, about which the description said nothing misleading, are judged against chance (50%): below chance invalidates. Choosing the named version on misled details is the measure, so those answers are never judged against chance. One side on 90% of answers invalidates when control accuracy is not above chance. Answers under 200 ms on at least half the questions invalidate. Fewer than half the questions answered invalidates, and any other unanswered question is flagged. Control accuracy at or under 50% is flagged and withholds the percentile. A hidden tab withholds the percentile.
Why these rules
Accuracy significantly below chance (one-sided exact test, p < .05) cannot come from guessing; it means the response mapping was reversed or the task was not followed (Slick, Sherman and Iverson 1999 treat below-chance forced-choice performance as definite response bias). Chance-level accuracy can be a real result in impaired participants, so it is only flagged. The misleading sentences are written to draw answers away from what was seen, so accuracy on misled details can fall below chance in an engaged participant, as Loftus, Miller and Burns (1978) found; only control details can show that the task was not followed. One option on at least 90% of answered trials, when the correct options are balanced and accuracy is not above chance, means the answers did not depend on the items (the task counterpart of long-string responding in surveys; Curran 2016). An answer under 200 ms is faster than a simple visual reaction, so it cannot reflect the item. Following response-time effort screening for untimed tests (Wise and Kong 2005), the session is invalid only when at least half the answers are that fast. Control accuracy at chance means the story was not encoded, and then no drop can be measured. A hidden tab lets the study, delay or response timers run without the participant, so a percentile is withheld after one.
No percentile. Scores and quality flags only.
Running this test
Settings you can change
| Setting | Standard | Allowed |
|---|---|---|
| Time per picture of the story (seconds) | 6 | 4 to 10 |
| Arithmetic before the description (seconds) | 60 | 0 to 300 |
| Explain the misleading details at the end | On | On or off |
Yearly plans can change settings within these limits. Free and pay-as-you-go studies use the standard settings.
Need a setting this test does not have?
Devices and languages
- Untimed test: runs on desktops, laptops, tablets and phones. Participant devices
- Languages: English, Spanish, French, German, Italian, Portuguese (Brazil), Chinese (Simplified) and Japanese.
- Available on: Every plan, including the free plan.
- No percentile. Scores and quality flags only. How norms work
- Recruiting online? See the setup guides for Prolific, Sona Systems, CloudResearch Connect and Qualtrics.
Cite and describe
Participants completed the Misinformation Effect Task in a web browser (ConductCognition task version 1.0.0, scoring version 1.0.0; Loftus, Miller & Burns, 1978; Loftus, 2005), with the standard settings (time per picture of the story (seconds): 6; arithmetic before the description (seconds): 60; explain the misleading details at the end: On). The main score was misinformation effect (accuracy on control details minus accuracy on misled details).
ConductCognition versions: task version 1.0.0, scoring version 1.0.0. Every export records the versions each session used, for a methods section.
- Loftus, E. F., Miller, D. G., & Burns, H. J. (1978). Semantic integration of verbal information into a visual memory. Journal of Experimental Psychology: Human Learning and Memory, 4(1), 19-31. https://doi.org/10.1037/0278-7393.4.1.19Misleading and control information after a pictured event, and the two-choice test.
- McCloskey, M., & Zaragoza, M. (1985). Misleading postevent information and memory for events: Arguments and evidence against memory impairment hypotheses. Journal of Experimental Psychology: General, 114(1), 1-16. https://doi.org/10.1037/0096-3445.114.1.1What the two-choice test can and cannot show.
- Zhu, B., Chen, C., Loftus, E. F., Lin, C., He, Q., Chen, C., Li, H., Xue, G., Lu, Z., & Dong, Q. (2010). Individual differences in false memory from misinformation: Cognitive factors. Memory, 18(5), 543-555. https://doi.org/10.1080/09658211.2010.487051A picture story and a narrative with misleading details.
- Loftus, E. F. (2005). Planting misinformation in the human mind: A 30-year investigation of the malleability of memory. Learning & Memory, 12(4), 361-366. https://doi.org/10.1101/lm.94705Review of the misinformation effect.
Source papers
- Loftus EF, Miller DG, Burns HJ (1978). Semantic integration of verbal information into a visual memory. Journal of Experimental Psychology: Human Learning and Memory, 4(1):19-31.Paradigm source, Young adults
- Loftus EF (2005). Planting misinformation in the human mind: a 30-year investigation of the malleability of memory. Learning & Memory, 12(4):361-366.Paradigm source, Mixed
- McCloskey M, Zaragoza M (1985). Misleading postevent information and memory for events: arguments and evidence against memory impairment hypotheses. Journal of Experimental Psychology: General, 114(1):1-16.Paradigm source, Young adults
- Zhu B, Chen C, Loftus EF, Lin C, He Q, Chen C, Li H, Xue G, Lu Z, Dong Q (2010). Individual differences in false memory from misinformation: cognitive factors. Memory, 18(5):543-555.Paradigm source, Young adults
Questions
How long does the Misinformation Effect Task take?
About 7 to 9 minutes, as listed in the test library.
What device does a participant need?
Untimed test: runs on desktops, laptops, tablets and phones. The browser must be Chrome, Edge, Firefox or Safari.
What scores does it produce?
Misinformation Effect, Accuracy, Misled Details, Accuracy, Control Details, Accuracy, Suggestions Chosen, Median Answer Time, Reading Time, Median Reading Time per Page, Anticipations, Questions Answered and Questions Planned. Each session is also marked valid, needs review or invalid, with the reason.
How widely is the Misinformation Effect Task used in research?
143 papers from 2021 to 2025 name it in their title or abstract, up 15% compared with 2016 to 2020. That ranks it 156 of 395 test families in the ConductCognition test census (use grade C). Source: ConductCognition test census 0.14.0, counted 31 October 2026 from OpenAlex and ClinicalTrials.gov.
How much reliability evidence does the Misinformation Effect Task have?
In the published research, 0 papers report its test-retest reliability and 0 registered clinical studies use it as an outcome (evidence grade C in the ConductCognition test census).
Does it report a percentile?
No. Scores and quality flags only.
Which settings can a researcher change?
Time per picture of the story (seconds) (4 to 10), arithmetic before the description (seconds) (0 to 300) and explain the misleading details at the end (On or off). Settings can be changed on yearly plans; free and pay-as-you-go studies use the standard settings.
Which languages can participants use?
Participants can take this test in English, Spanish, French, German, Italian, Portuguese (Brazil), Chinese (Simplified) and Japanese, with its words in the same language. English is on every plan, and the other languages come with yearly plans. Have a native speaker read the machine-translated text before launch.
Is this a clinical test?
No. ConductCognition is for research use only. It runs, scores and exports the test; clinical interpretation is outside the platform.
Every test: the full test list.
Run this test in your next study
Start free with 10 free participants on any test, then use participant credits or a yearly plan.